
KOSPI Historic 17.9% Surge Analysis
Analysis of KOSPI's Record-Breaking Surge (17.9%) and Future Outlook
Today, the KOSPI index made history with an unprecedented single-day surge of 17.9%, soaring by over 1,000 points. This marks the first time in South Korean stock market history that the index gained over 1,000 points in a single session. To navigate the future, a precise post-mortem of today's market dynamics is essential.
2nd Place: 2008 Global Financial Crisis — 11.9% (Sudden rebound in the midst of a crisis)
3rd Place: March 5, 2026 — 9.6%
4th Place: March 2020 COVID-19 Pandemic — 8.6%
5th Place: 1998 Asian Financial Crisis — 8.5%
Both the 1st and 3rd highest single-day gains occurred in 2026, marking it as an extraordinary year for the South Korean stock market. Historically, 8 out of the top 10 single-day gains in the US NASDAQ occurred during severe market crashes. Korea's historical pattern is largely similar, though March 5, 2026, demonstrated extreme volatility even without an active market crash.
Globally, this level of skyrocketing growth is unprecedented:
US Dow Jones Index (130-year history): Record high of 15% (1933 Great Depression)
US NASDAQ Index (Est. 1971): Record high of 14% (2001 Dot-com bubble burst)
Japan Nikkei Index: Record high of 14% (2008 Global Financial Crisis)
Germany DAX Index: Record high of 11% (2008 Global Financial Crisis)
In global market history, single-day record surges occurred exclusively during severe crises, often followed by secondary crashes. Consequently, years featuring record single-day gains historically ended poorly. Time will tell if the South Korean market can become an exception to this pattern.
Despite the unprecedented rally, the actual macroeconomic catalysts were minimal:
US Inflation Metrics: Remained a mere 0.1 percentage point below expectations—hardly a historic catalyst.
Big Tech Earnings: Earnings surprises from Microsoft and Amazon were positive, but similar beats have occurred routinely in the past.
US 10-Year Treasury Yield: Maintained high levels around 4.6%, remaining a clear headwind.
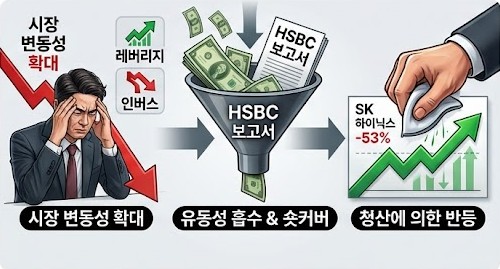
With no definitive fundamental catalyst, this move represents a "rebound driven by liquidation" rather than a fundamental rally.
National Pension Service (NPS) Positioning: The NPS increased its domestic equity allocation compared to historical levels, amplifying overall market volatility. Despite announcing rebalancing plans starting in July to reduce equity exposure, the pension fund net-purchased 1 trillion KRW over four days starting July 28. On July 31, during the extreme surge, it added another 164.7 billion KRW in net purchases, shifting from its traditional role as a market stabilizer to a driver of volatility.
Concentration in Single-Stock Leveraged & Inverse ETFs: Massive capital inflows into single-stock leveraged products deepened losses during downturns, inducing panic selling (e.g., SK Hynix's 53% drawdown). Squeezed investors heavily migrated into single-stock inverse (2x short) products, making them the second-largest ETF category. When the underlying stocks experienced minor rebounds, forced short liquidations (short squeezes) ensued, converting moderate recoveries into extreme price spikes.
The core mechanism of extreme surges follows a set sequence:
Panic Selling (Retail Capitulation) + Forced Liquidations (Systemic Margin Calls) $\rightarrow$ Exhaustion of Sell Orders (Liquidity Vacuum)
When persistent sell-offs completely drain selling pressure, minimal buy volume triggers exponential price jumps. This dynamic is further accelerated by short covering from short sellers.
Background: Former OpenAI researcher and Columbia University valedictorian at age 19.
Performance: Generated a 439% return through June using 4x leverage.
Collapse: A concentrated 4x leveraged position in SK Hynix collapsed during the stock's 53% drop, resulting in total fund liquidation and complete principal loss.
Market Impact: The market interpreted this event counterintuitively as a bullish sign. Under the narrative that even top-tier investors had been wiped out, traders assumed all remaining panic-selling volume was fully liquidated. This psychological shift sparked a rebound in US markets, which translated into an explosive rally in Korea (resembling the sharp market bounce following the forced liquidation of margin accounts by the Korean government in 1990).
TGA Rebalancing: The US Treasury absorbed liquidity rapidly between July 10 and July 28 by increasing TGA balances by over $220 billion (~300 trillion KRW), which drove the prior equity decline.
Absorption Pause: As TGA balances reached target capacity, liquidity extraction was forced to pause starting July 31.
Fiscal Expectations: With the US midterm elections 95 days away, market expectations shifted toward potential government fiscal injection ahead of the vote.
Rebalancing Window: Provided an opportunity for investors trapped in heavy losses (e.g., SK Hynix down over -50%) to adjust position sizes.
Interrupted Liquidation Spiral: Temporarily halted the cascading margin call cycle caused by insufficient collateral.
Fear Relief: Temporarily neutralised extreme market fear following high-profile fund liquidations.
Historical Precedent: Globally, record single-day gains have occurred exclusively during broader bear markets, often followed by lower lows.
FOMO & Re-Leveraging Risks: Investors who sustained losses or were liquidated in inverse products face high risk if they aggressively re-enter leveraged positions. Executing 2–3 poor trades in this level of volatility can lead to total capital loss.
Incomplete Margin Liquidation: According to an HSBC report, South Korea's margin account liquidation rate sits at approximately 2%. The limited extent of leverage unwinding means underlying downside risks remain active.
Persistent Volatility: Monthly returns remain near -23%, exposing investors to high volatility that risks driving market fatigue.
Prior to the surge, the KOSPI declined 38.6% from its high of 9,114 to a low of 5,593. Closing today at 6,595, the index has recovered 28.5% of its total drop.
In historical bear markets, technical rebounds (dead cat bounces) typically retraced 40% to 60% of the preceding drop:
Historical Event Decline Depth Rebound Retracement
1929 Great Depression 50% 50%
2008 Financial Crisis - 58%
1990 Bear Market - 53%
Applying these historical benchmarks, even a standard dead cat bounce could extend toward the 7,000 – 7,700 range.
The zone up to 7,700 must be evaluated cautiously as a potential dead cat bounce rather than a confirmed V-shaped recovery. A sustained breakout above 7,800 – 8,000 is required to signal structural stabilization.
To distinguish a structural recovery from a temporary bounce, monitor the following indicators:
Resolution of AI Investment Concerns: Partially mitigated by Big Tech earnings, but structural concerns remain.
Long-Term Yield Trajectories: US 10-year Treasury yields (~4.6%) and South Korean 10-year Treasury yields (~4.2%) must enter a sustained downtrend to stabilize equity valuations (for context, Korean 10-year yields hovered around 2.7% in May of last year).
Leverage Balances: A renewed rise in leveraged product balances increases secondary crash risks, whereas declining leverage supports sustained upside structure.
Foreign Capital Continuity: Foreign investors net-purchased 7.2 trillion KRW today; however, much of this volume likely represented short covering. Sustained net buying over subsequent sessions is required for confirmation.
Rule 1: Never chase momentum on hyper-green breakout days.
Rule 2: Never panic sell into severe market liquidations.
Equity markets do not move linearly. Even within severe bear markets, historic single-day rallies occur. Buying at peak euphoria and panic selling at local lows remains the most damaging capital allocation strategy.
Support the independent voice of Ludens Times
Today's Reflection
Record your daily action inspired by today's article.
The Ludens Times Digest
Get our latest inspirations delivered straight to your inbox.